02. Assignments
Assignment 09
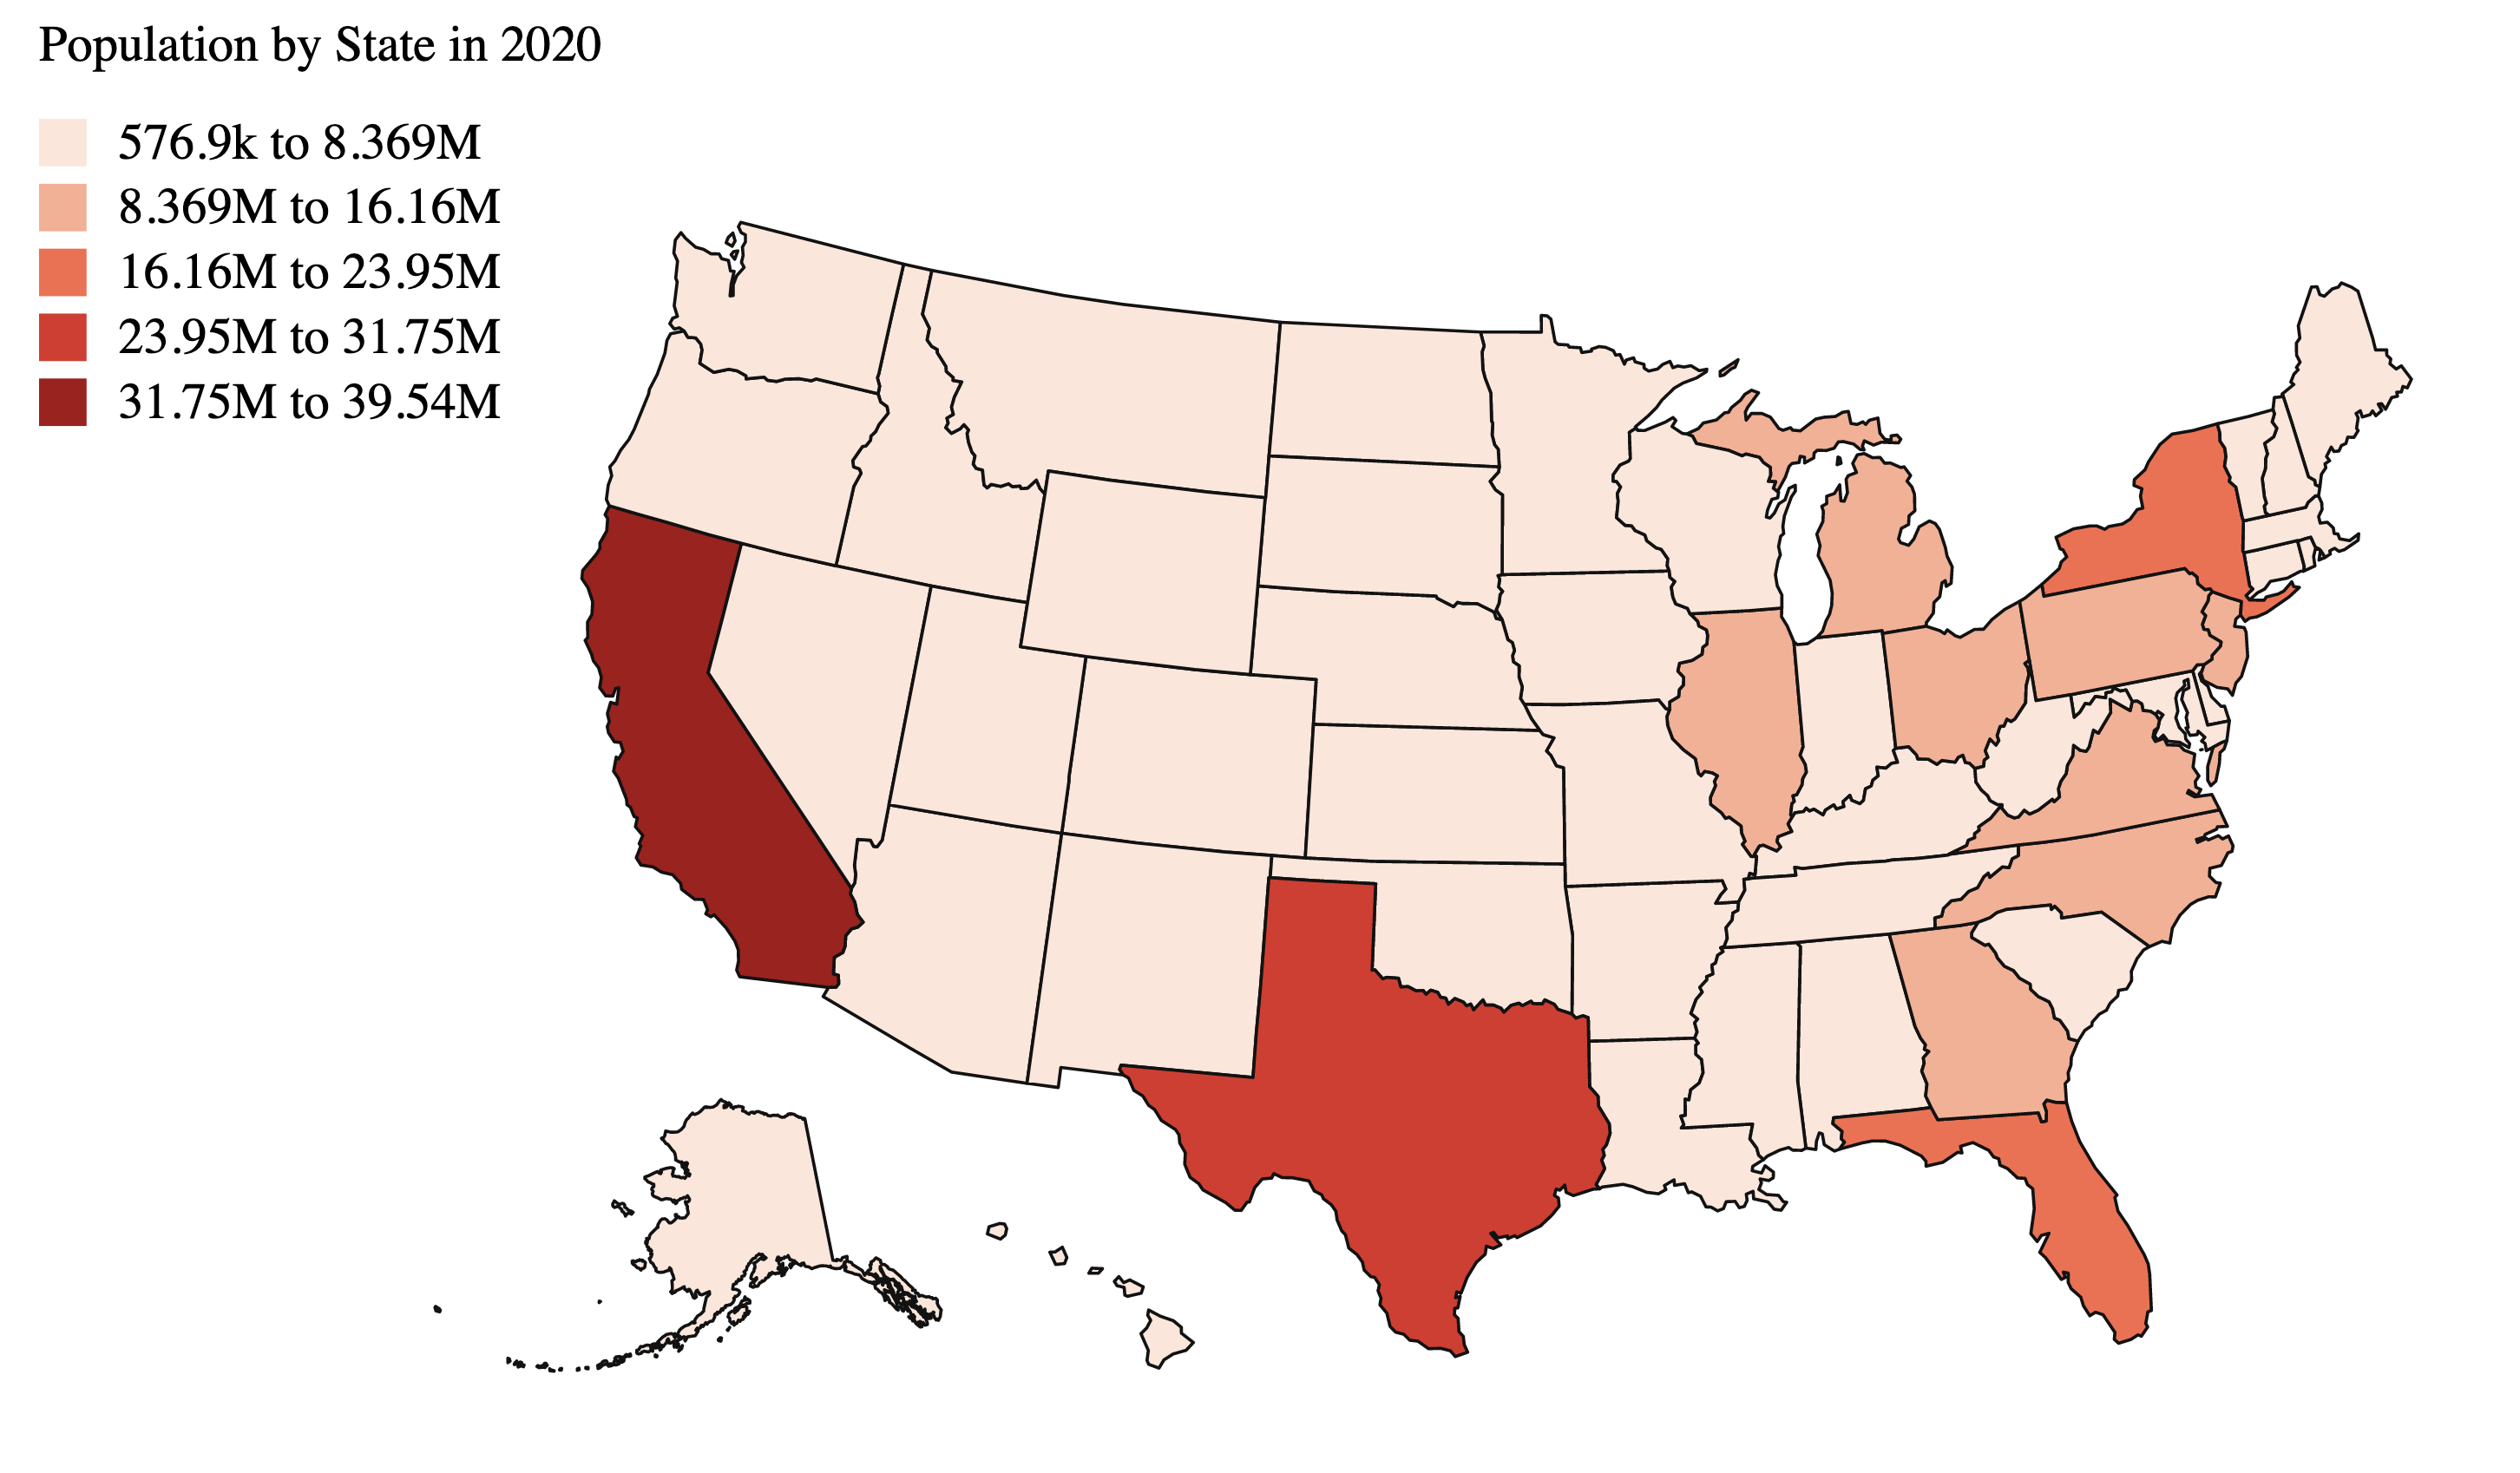
GeoVisualization in D3
For this assignment, I visualize geospatial data using d3. This is done with a choropleth map showing population and a proportional symbols map showing housing cost.
Learn MoreD3, JavaScript, HTML, CSS, ColorBrewer
Assignment 08
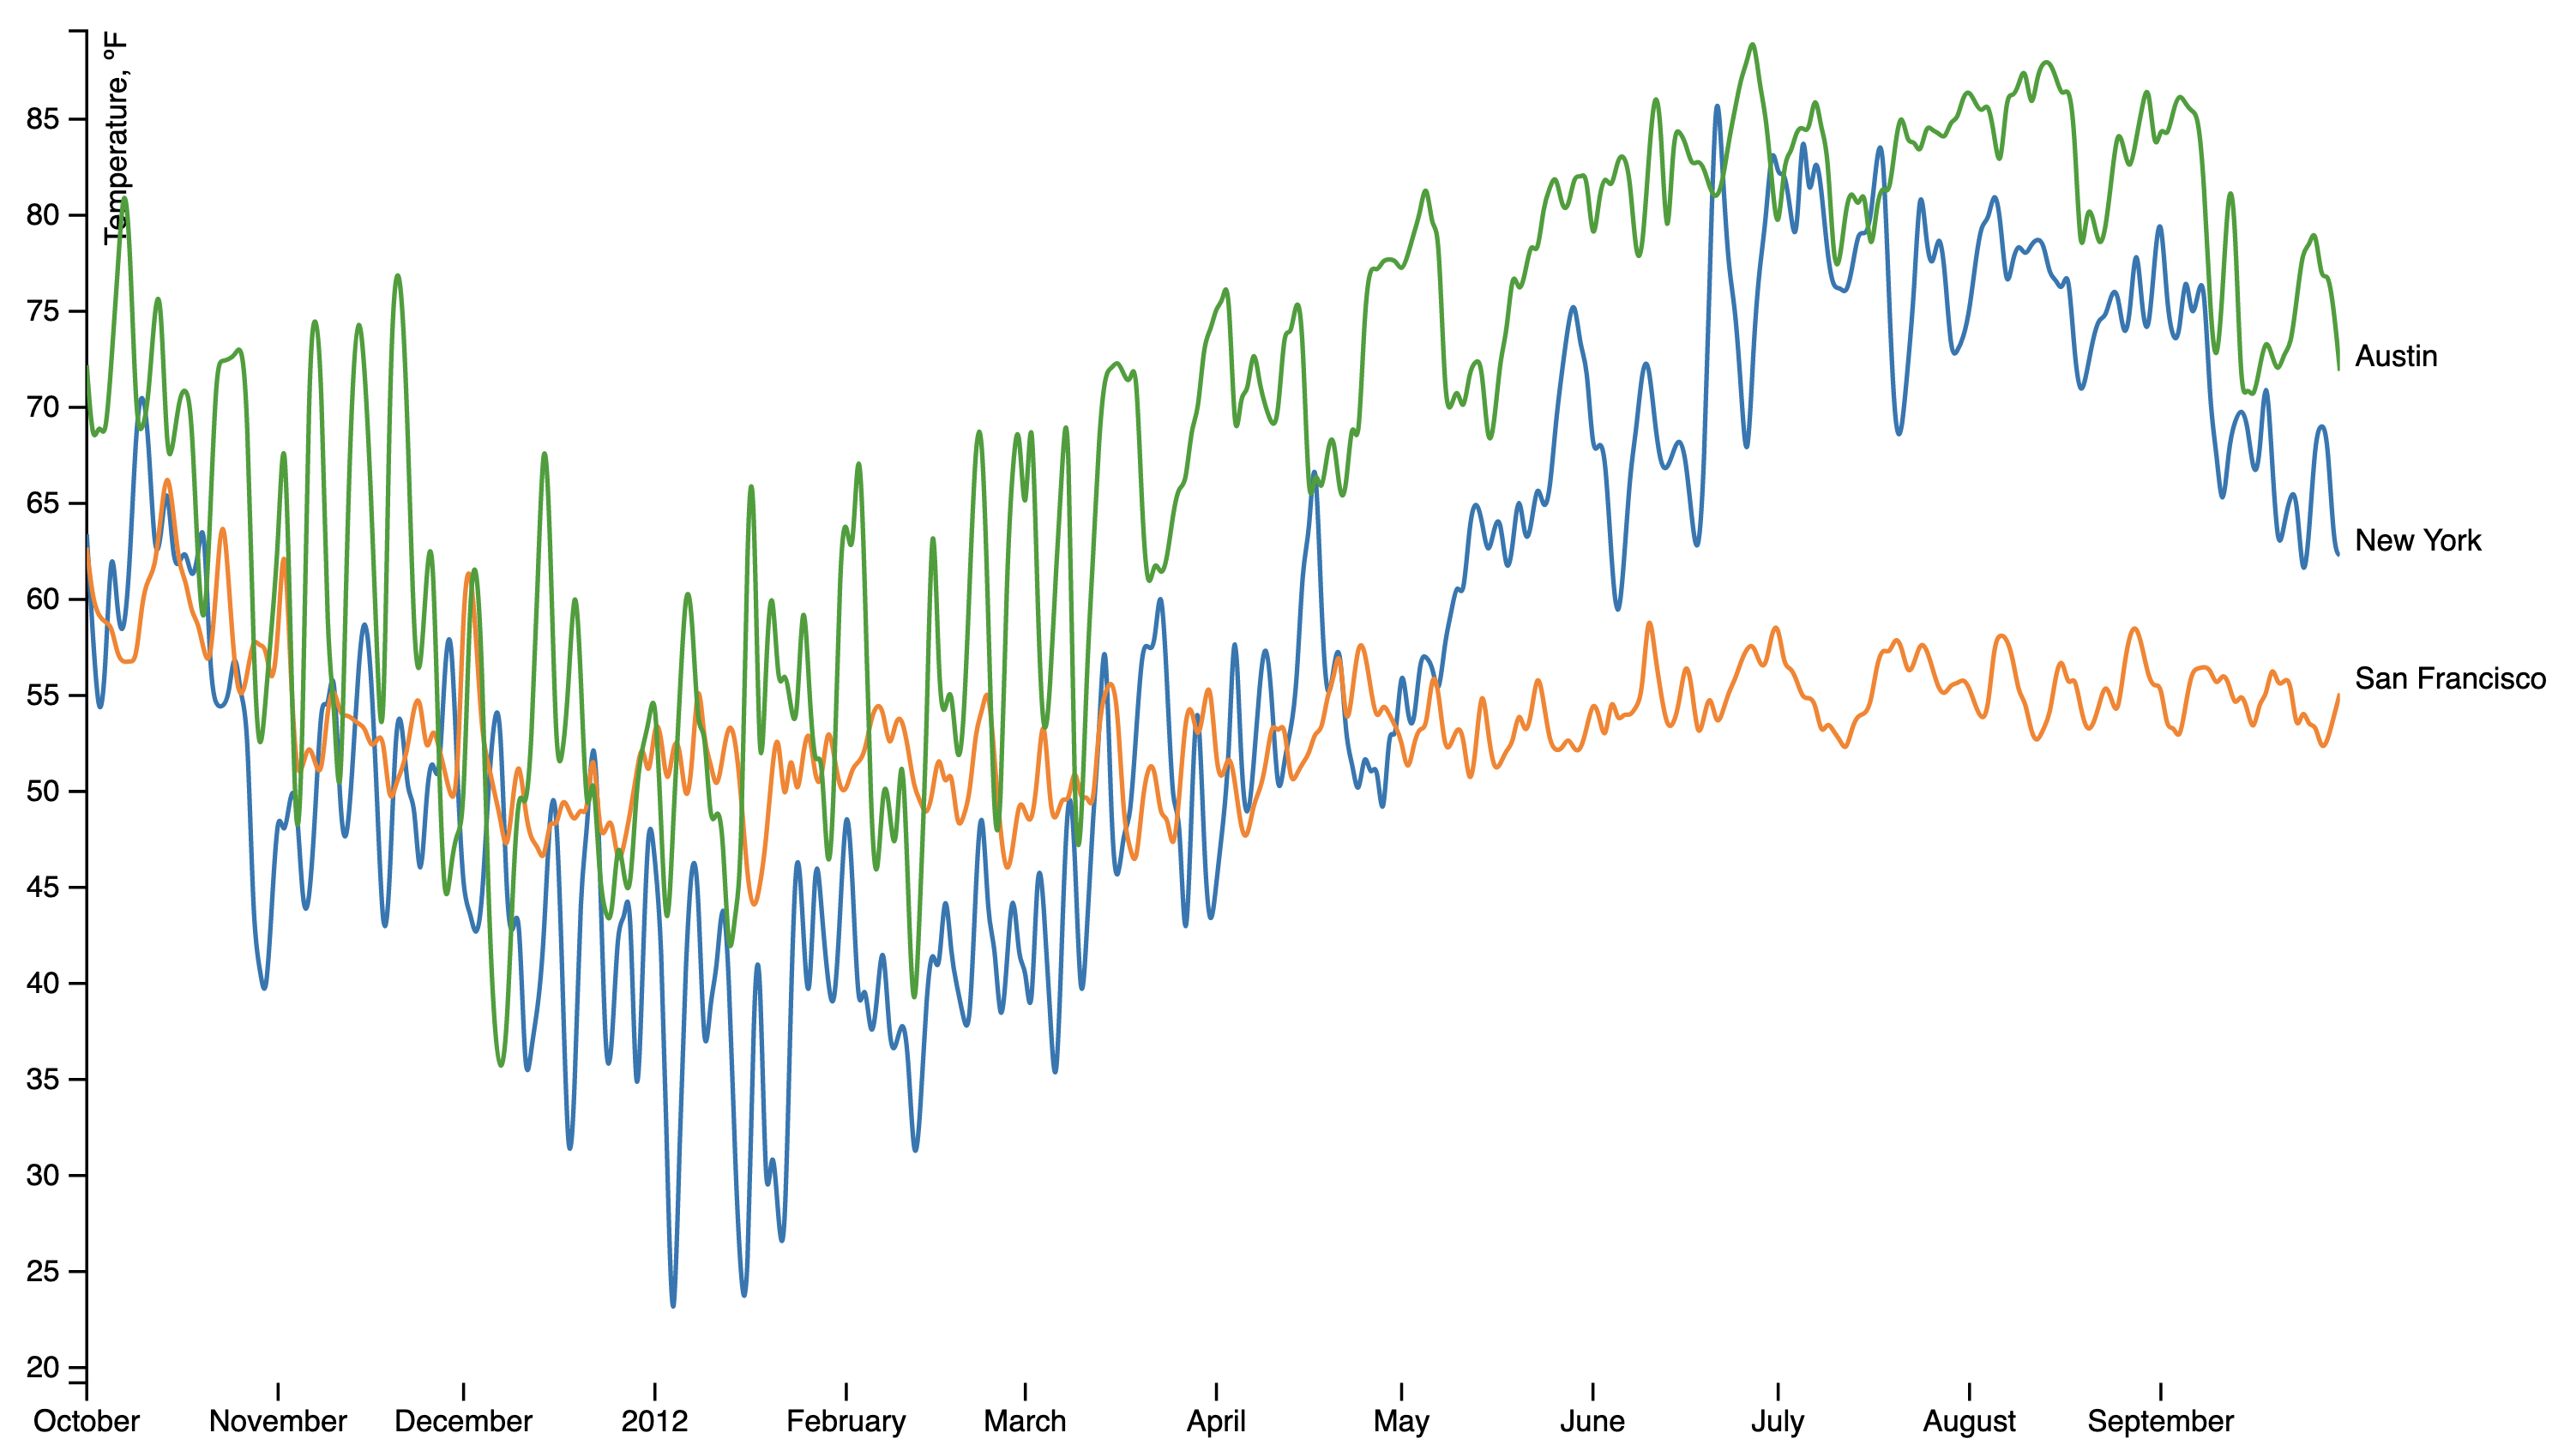
Interaction in D3
Explored interaction techniques in D3 like filtering, brushing, and zooming/panning using a provided line chart.
Learn MoreD3, JavaScript, HTML, CSS
Assignment 07
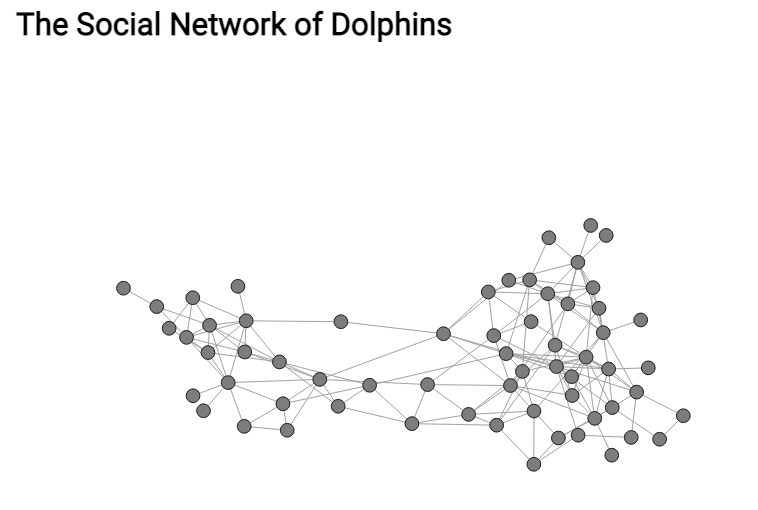
Graph Visualization
Visualizing graphs and related nodes using D3. I implemented a force directed layout and an adjacency matrix.
Learn MoreD3, JavaScript, HTML, CSS, Python
Assignment 06
Color Scales in D3
An exploration of color scales in D3.
Learn MoreD3, JavaScript, HTML, CSS, ColorBrewer
Assignment 05
Multidimensional Visualization in D3
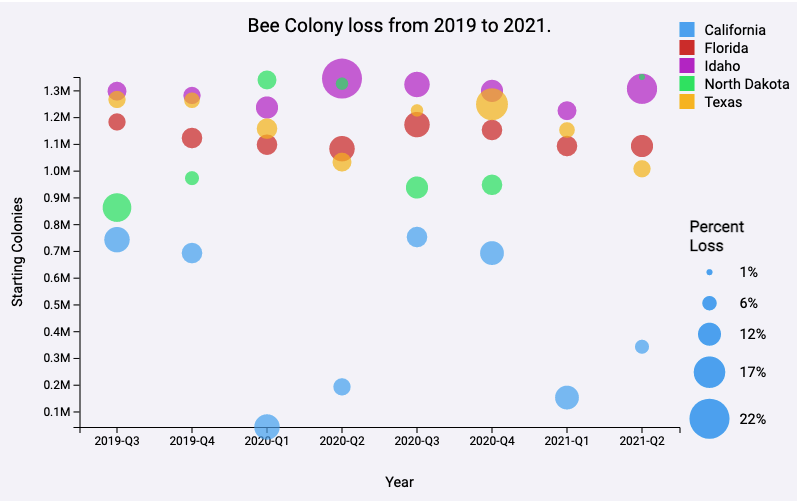
Using a dataset on bee colony loss, I explore multidimensional visualization techniques in D3.
Learn MoreD3, JavaScript, HTML, CSS
Assignment 04
Introduction to D3
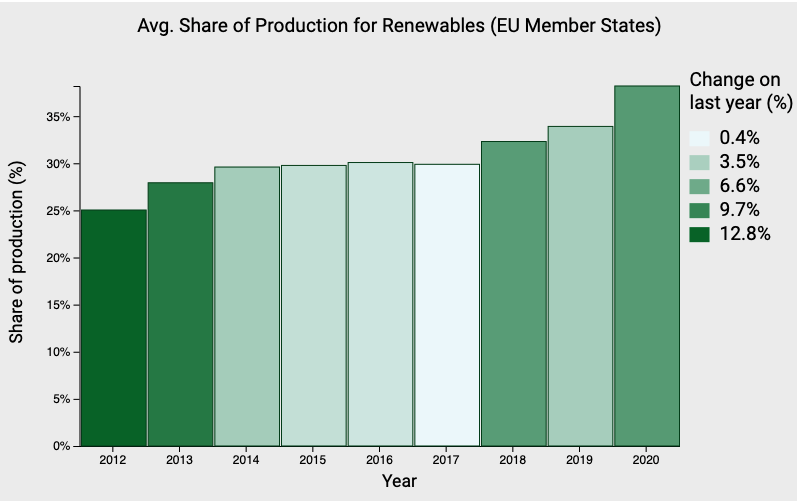
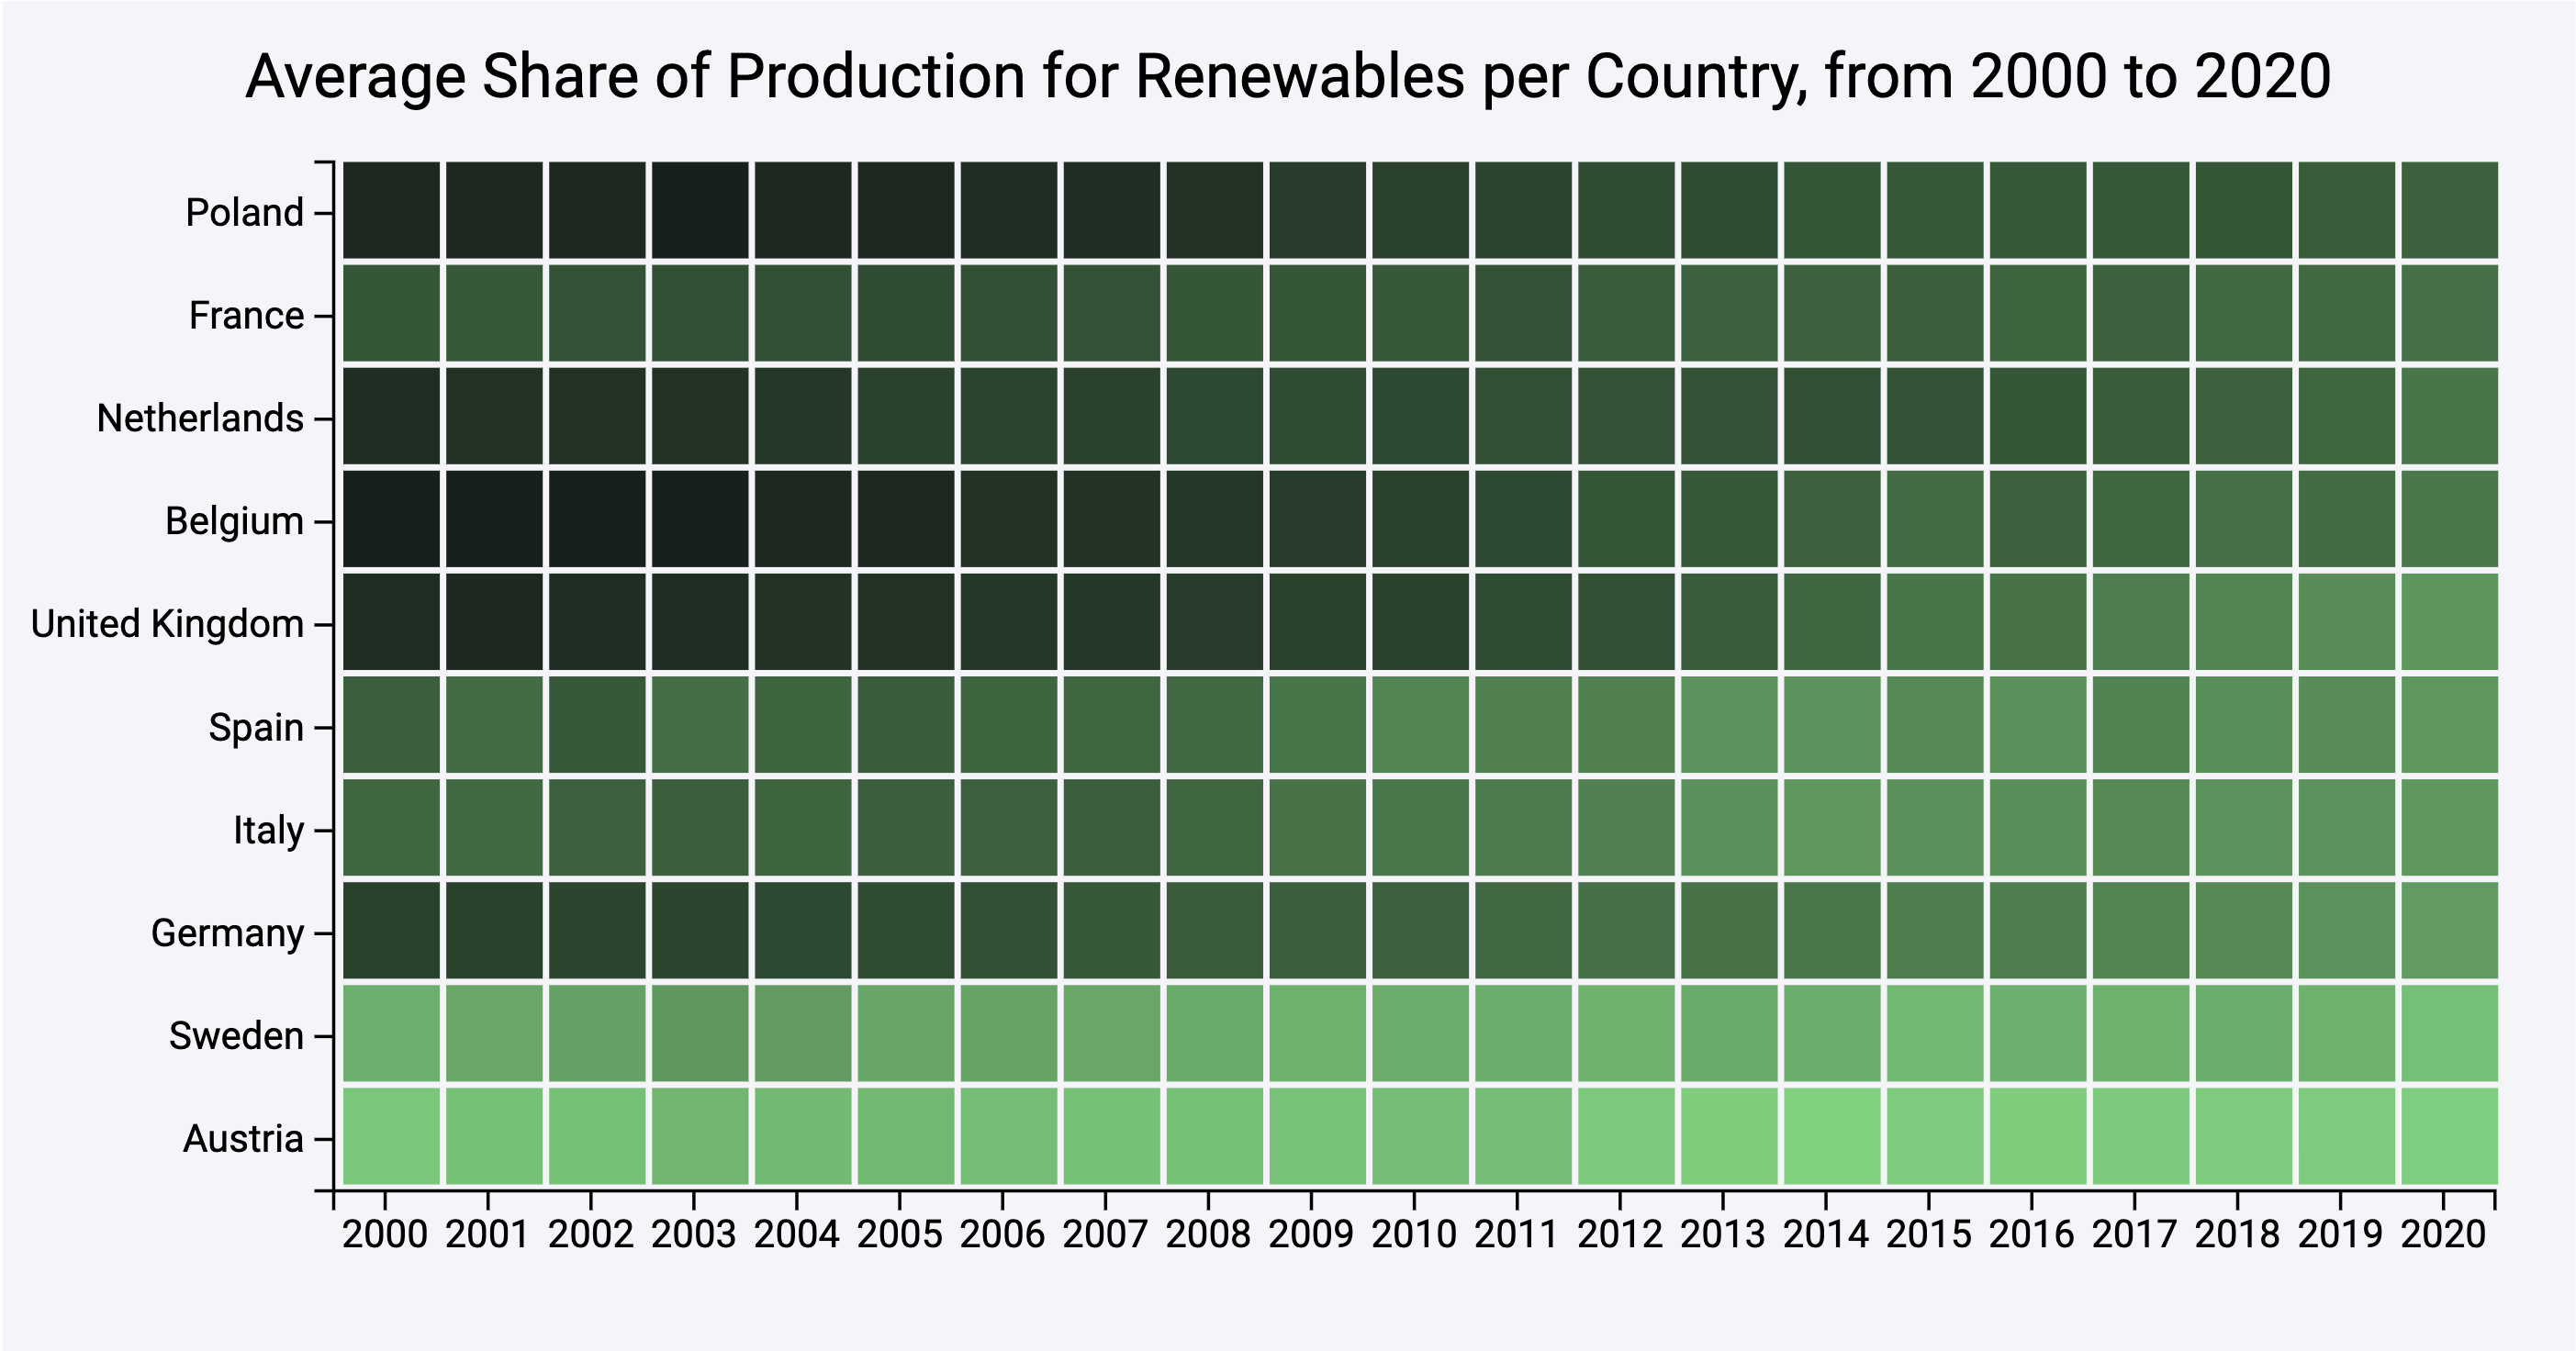
In A4, I am introduced to D3.js by implementing a Bar Chart, Scatter Plot, and Heatmap of the dataset on the European Power Sector I used for A2 and for A1.
Learn MoreD3, JavaScript, HTML, CSS
Assignment 03
Visualizing Distributions using P5
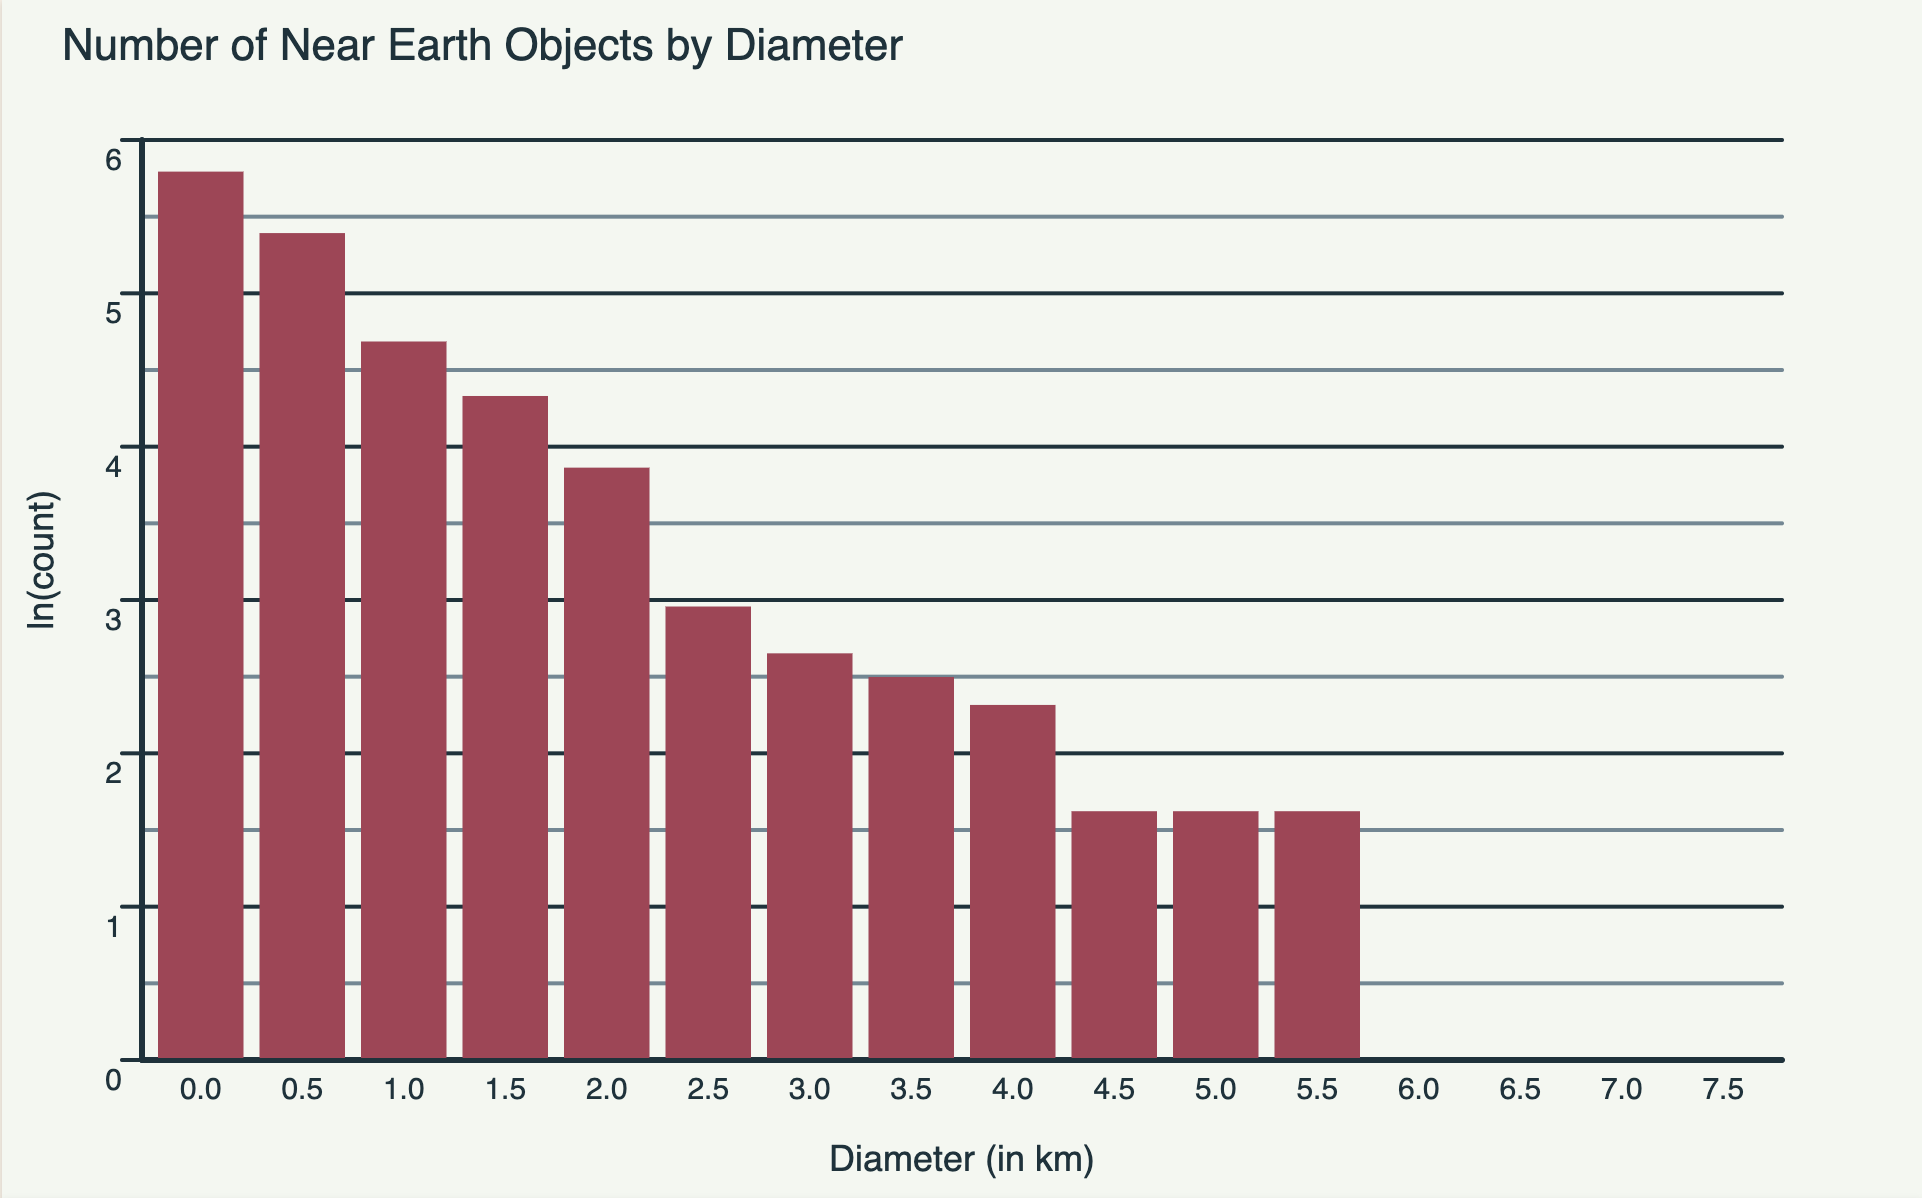
Experimentation of distributions using p5.js with a dataset on asteroids from NASA's JPL. Distributions are shown using a histogram and a box plot.
Learn MoreP5, JavaScript, HTML
Assignment 02
Visualizing Amounts using P5
An introduction to data visualization in P5.js using the same dataset as A1. Data shown using a bar chart, dot plot, and heatmap.
Learn MoreP5, JavaScript, HTML

Assignment 01
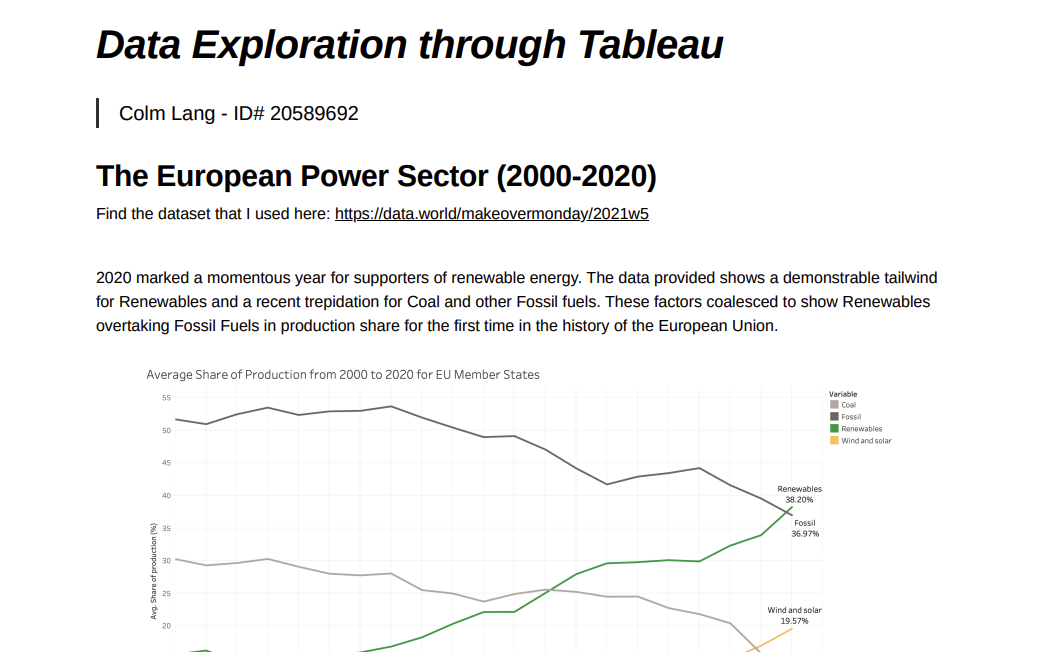
Data Exploration with Tableau
A data exploration report on the European Power sector from 2000 to 2020.
Learn MoreTableau